
How to read a class gradebook (and what it cannot tell you)

Watch a teacher open a class grid for the first time and they almost always do the same thing: start at the top left, read along the first student's row, then the second, one child at a time. It is the natural way to read a table. It is also the slowest way to find anything, and it is how you end up worried about a child when the real problem was the worksheet.
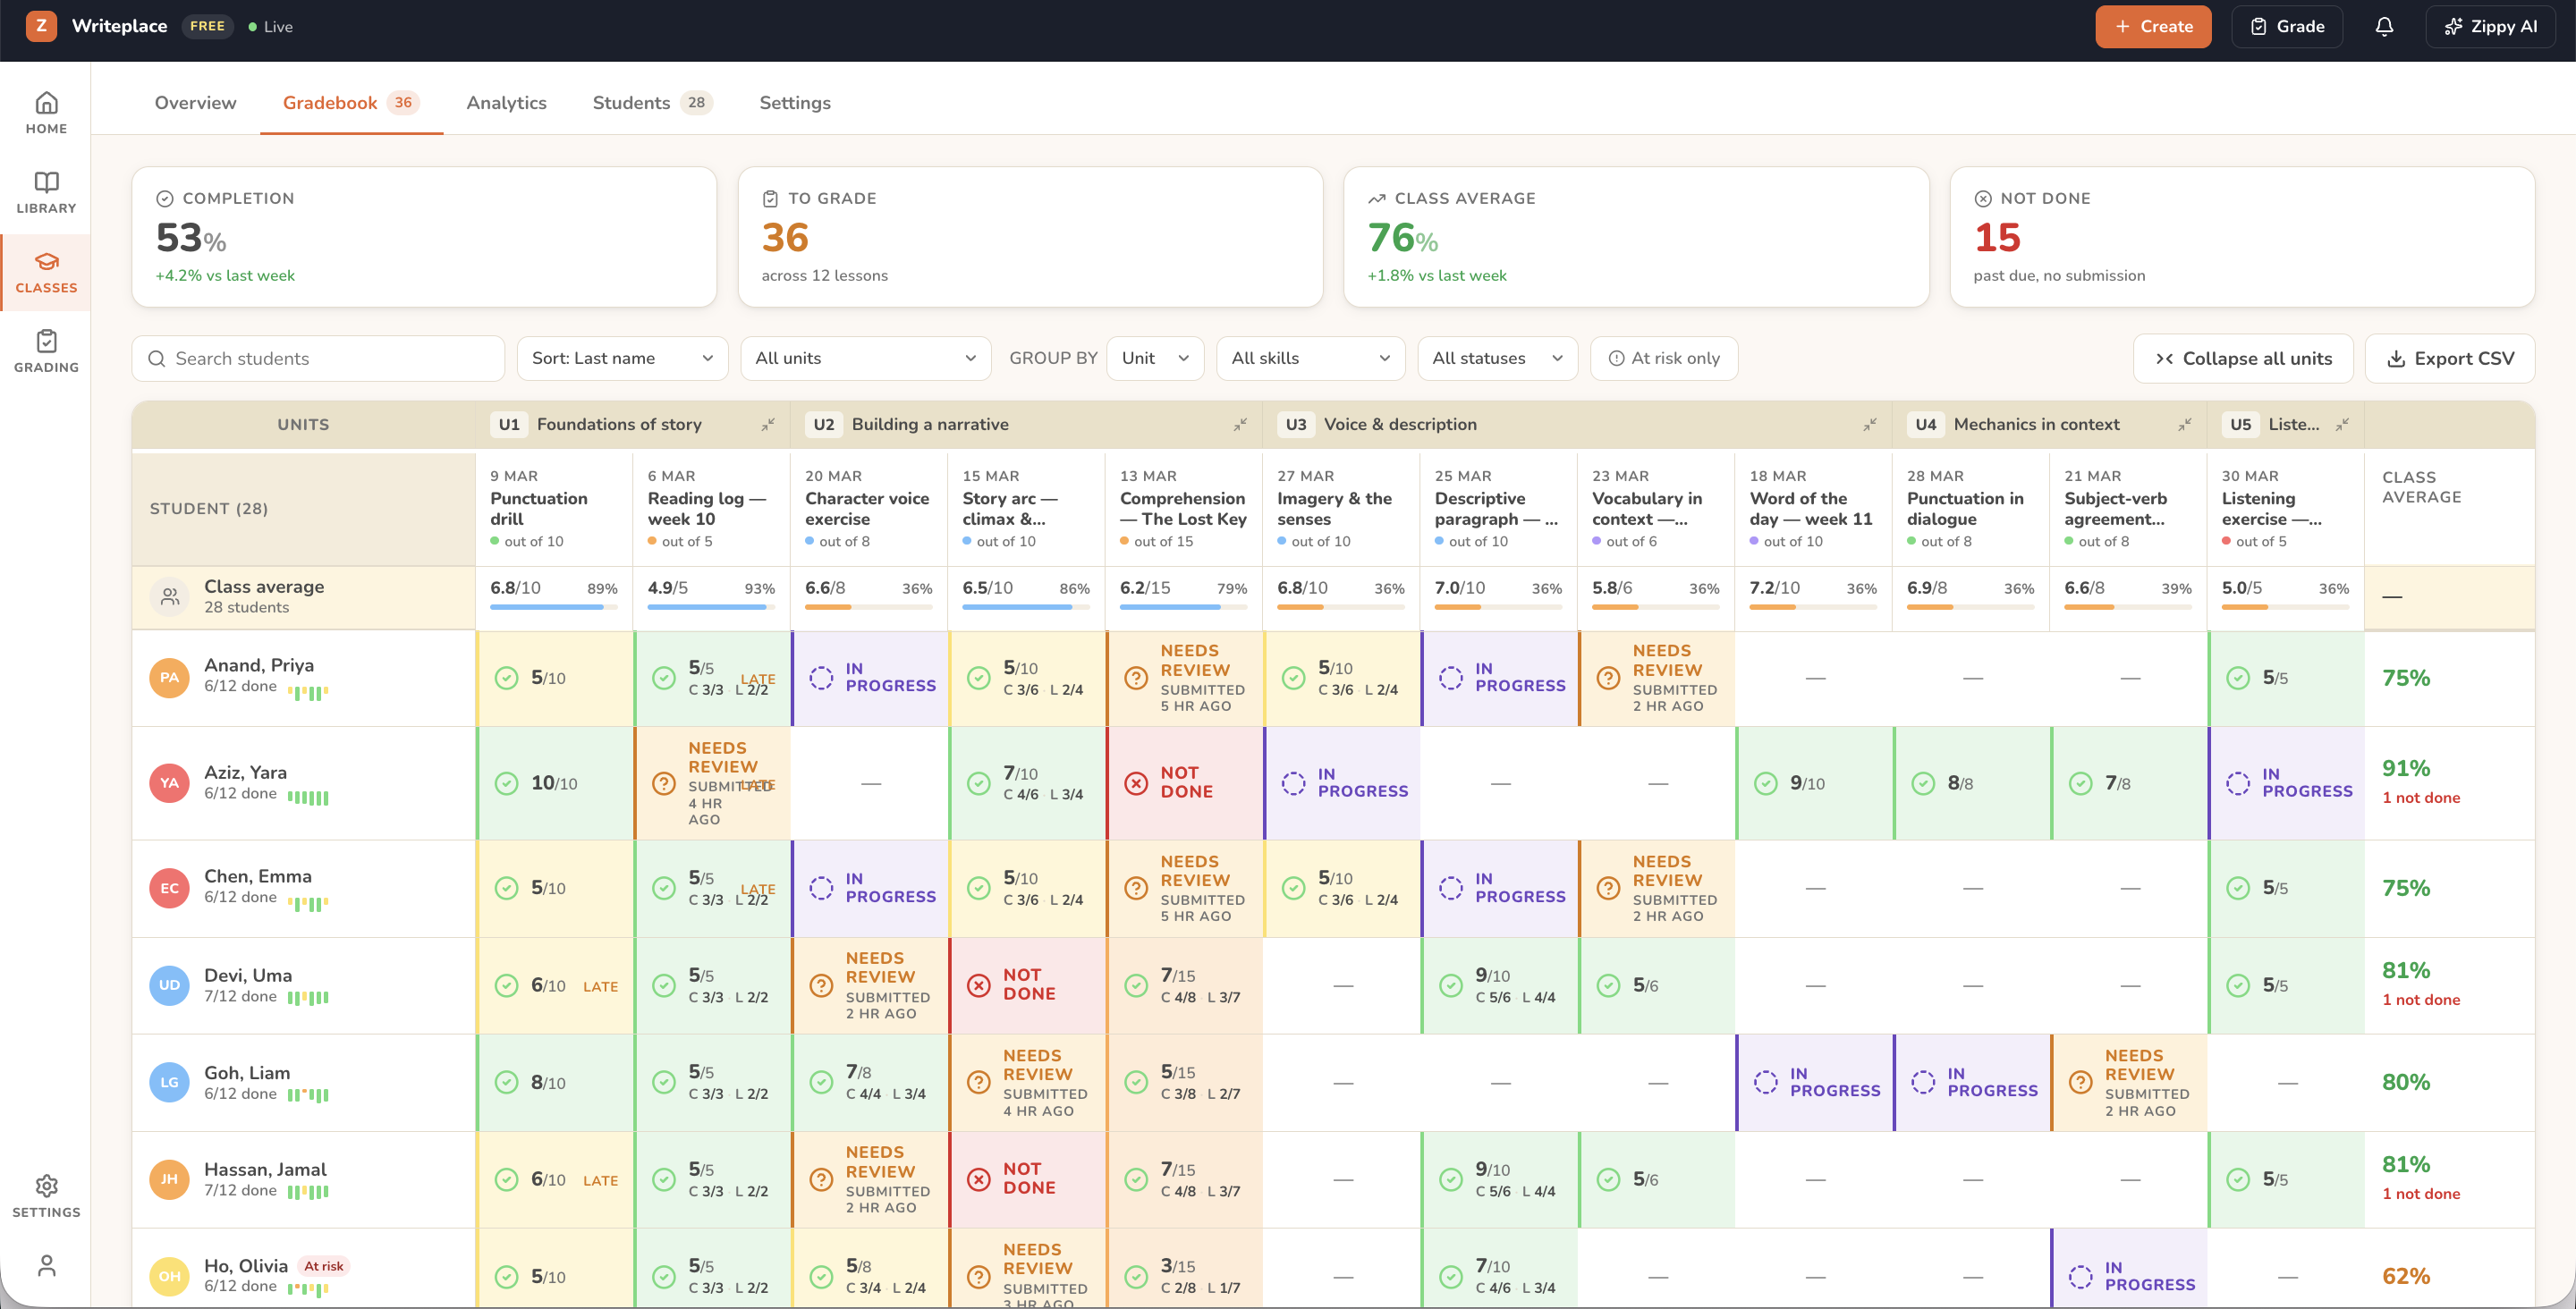
Read the class average row first. Everything else on the screen is easier to interpret once you have.
Start with the average row, not the first student
The row directly under the activity headers is the class average for each activity. Read it left to right before you look at a single name.
If four compositions sit in the high 60s and the fifth sits at 51, you have learned something about the fifth composition. Thirty children did not simultaneously get worse at writing. Something about that task was harder than you meant it to be: the question had two readings, the stimulus was above the reading level you had in mind, or you set it the week of the concert.
The grid cannot tell you which of those it was. It can only tell you where to look, which is worth more than it sounds, because the alternative is drawing conclusions about children from a problem that belongs to a worksheet.
It is also the thing you want to know before you set anything similar next term.
One low mark is not a trend
A child can have a bad Tuesday. They can be coming down with something, or sitting next to someone new, or have simply not read the question. None of that is a pattern, and marking it as one is how a teacher ends up in a parent conversation defending a single number.
What you are looking for is a student sitting below their own usual line across several activities. That is a trend, and trends are the only thing in a gradebook you can really act on.
The At risk only filter is there so you do not have to spot this by eye. Turning it on collapses thirty rows to the four or five students the analytics have flagged, which is a list short enough to actually do something with on a Monday. Sorting by most not done first makes it shorter still.
We would rather that list stayed short. A flag on twelve children out of thirty is not a flag, it is a mood, and teachers learn to ignore dashboards that cry wolf. If the filter surfaces half your class, treat that as a fact about the term rather than a to-do list.
Open the cell that surprises you
Sometimes a strong writer produces one weak piece, or a struggling one produces something much better than usual. That is neither a task problem nor a trend, and no amount of staring at the number will explain it.
Click the cell. You land on the marked script with the comment, the next step and the inline annotations already there. Often the answer is visible in the first paragraph: they ran out of time, they wrote a genuinely good opening and stopped, they answered a different question well.
This is the loop the grid exists to close. See something odd, open it, read what actually happened.
One number per cell hides what you need to teach
By default each cell shows a single score, and that score is an average of things that are not much like each other.
Change View to Rubric breakdown and every cell opens into the traits you assess. Two children on 18 out of 30 stop looking identical. One is carrying the mark on content with the language pulling it down; the other is fluent and has almost nothing to say. Same number, different lesson on Monday.
This is the setting most teachers never touch, and it is the one that changes what the gradebook is for. A score records where a child finished. The breakdown is the part you can plan from.
Completion and attainment are different questions
Two numbers at the top of the grid get read as if they were one.
Class average tells you how the work that came in was scored. Not done counts work that is past due with nothing submitted at all. A class average of 68 sitting next to nine pieces not done is a specific and fairly common situation: the work is landing for the children who attempt it, and what you have is a submission problem.
That is a conversation about deadlines, workload or what is going on at home. Reteaching the content will not touch it.
Reading those two together, rather than one at a time, is most of the skill.
What the grid cannot tell you
Everything on the screen is derived from marking you have already approved. Nothing is inferred and nothing is predicted. If you overrode a score, the grid uses your score, which is the whole reason it is worth trusting: it is not a second opinion about your class, it is your own marking arranged so the shapes are visible.
That also fixes its limits. The grid does not know that two of your strongest writers were away on a trip the week you set the essay, that Term 3 lost a fortnight, or that the child at the bottom of the column started at your school in April. It has no view on whether the dip in column five matters. It can show you a shape and tell you nothing about the cause.
So we are not going to claim that reading a grid well improves results. What it does is stop you spending Monday on the wrong child.
The guide
Step by step, with a recording of the real grid:
And when you want to send any of it onward, exporting student reports covers turning marked work into a document you can hand to a parent.